Need to debug JavaScript or HTA?
Don't know where to start or set a breakpoint? We've been there. We needed a fast JavaScript Debugger that can easily handle debugging complex JavaScript.
That's why we developed SplineTech JavaScript Debugger.
Enter URL, Press Run!
That's it, you are debugging!
Completely outside the browser!
Give yourself 5s to move mouse over an element you need to click before it pauses!
Debug without knowing where to set a breakpoint!
Revisit every step!
Step Through to skip boring code and stop in a next function call automatically!
Reformat Script:
Make minimized, obfuscated code readable and debuggable!
Call stack: which function called this one?
Current Variable panel shows
long text values.
Very convenient!
THE FASTEST Debugger on the planet! Blazingly fast! Debug huge sources with ease!
Nothing compares to it or even comes close.
SplineTech JavaScript Debugger is
the fastest independent standalone JavaScript Debugger that enables
you to debug JavaScript for IE completely independently of any add-ons, plug-ins, Java or any other third-party software tools.
Since SplineTech JavaScript Debugger is a 100% pre-compiled independently pre-built .exe product (not an interpreter, not based on Java or any other platform), it's the fastest JavaScript Debugging software tool available.
Native JavaScript, JScript and VBScript debugging languages are
fully supported for complex JavaScript, JQuery, HTA, MS Dynamics CRM, Ext-JS and AJAX debugging scenarios.
SplineTech JavaScript Debugger Features
Fastest Independent standalone full-featured JavaScript Debugger, JScript Debugger and
AJAX Debugger
for HTML, DHTML and AJAX
Native JavaScript, Native JScript and Native VBScript Fully Supported
100% standalone JavaScript Debugger -
No add-ons required
100% independentJavaScript Debugger - No additional / third-party software required
No web-based debugging interfaces
or pop-up windows
No Java/JVM/JRE required
No attaching to process needed
Fully Supports Native Browser-Side JavaScript,
Native JScript and Native VBScript
Does not emulate
JavaScript, JScript or VBScript
This means no portability issues -
if your code works under SplineTech JavaScript Debugger it will work outside SplineTech JavaScript Debugger
Debug jQuery, Ext-js, Prototype.js, UIZE, Dojo, Wijmo under IE!
Debug dynamically loaded JavaScript, including dynamically generated
JavaScript in remote files
Just type any
URL (http:// or http://) pointing to any remote or local JavaScript file, and click Go
Debug JQuery, AJAX, JavaScript, ExtJS, DHTML pages
dynamically generated by PHP, ASP.NET,
Classic ASP and JSP
Easily debug
remote JavaScript files - no need to have the file physically on your
machine. Remote AJAX, JavaScript, HTML and DHTML files are
fully supported
Feature available exclusively on SplineTech JavaScript Debugger
Debug any sequence of HTML and JavaScript
pages simply by following links, submitting forms or even typing
in a new URL
Debug
unlimited number of HTML pages (JavaScript pop-ups
etc.) at the same time
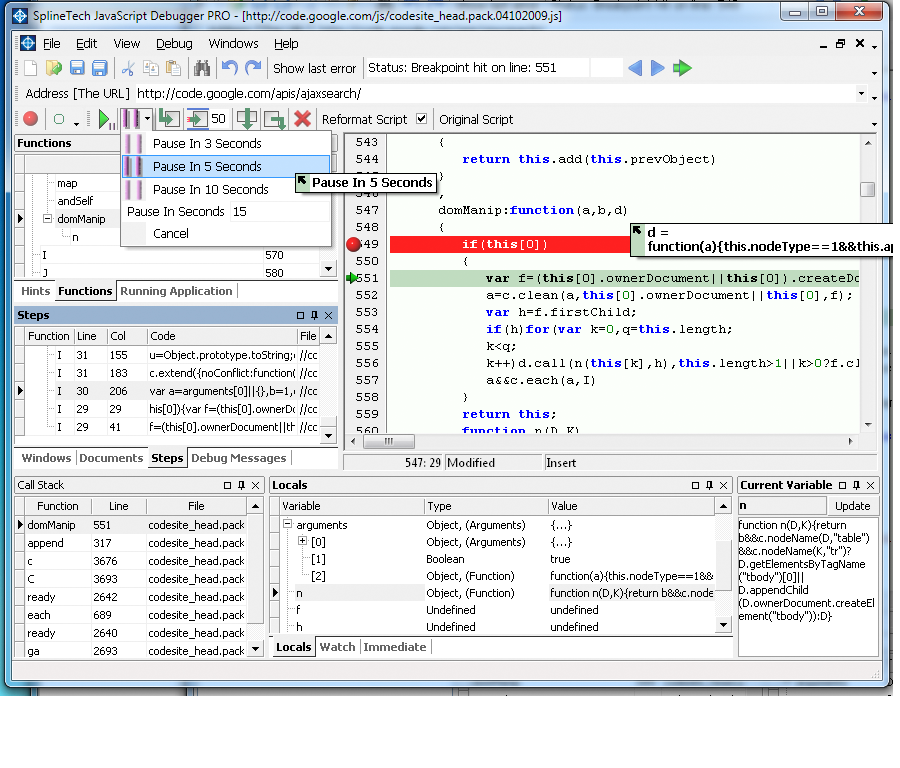
Pause in 3, 5, 10 seconds
Now
you can easily skip all mouseover/mouseout etc. and
pause precisely on the event that you are debugging
Very
useful for debugging JQuery, Ext-JS and complex AJAX controls
Feature available exclusively on SplineTech JavaScript Debugger
Complete Function List
See all
functions in your code
Instantly jump
to any function from the list by clicking on
its name
Integrated movable
dockable Function List window
Highlights the
beginning of the clicked function in the code
Call Stack
Panel
See
a list of all function calls, from the
first up to the current one, with all line numbers,
function names and file names, in a convenient
movable dockableCall Stack Panel
Jump to any functionindicated
in this list by double clicking it.
Now you can easily debug obfuscated JavaScript code and AJAX controls
with compressed JavaScript code with 1 click of a [Reformat Text] button
Feature available exclusively on SplineTech JavaScript Debugger
Replaces obfuscating characters in strings. For
example: ie =
"Mi\143rosof\164\040I\u006e\164\u0065\162ne\u0074\u0020Ex\u0070lorer"
becomes a readable string ie = "Microsoft Internet Explorer"
Monitor Local Variables and their properties in a convenient tree structure
All Local variables appear
automatically in a convenient
tree structure
No need to manually add your Local
Variables to watch - they are added automatically
Watch all your Local Variables in
a new LocalsPanel (movable dockable
internal window)
Easily change values of your Locals
right in the Locals Panel - at any time
Check all properties of
your Locals as they are updated automatically
Watch Expressions and
Variables in a convenient tree structure and change their values
as you go
Watch all your Variables and
Expressions
in a new separate WatchPanel
Add/Delete variables on the go
Change variable values
with one click
Add any Custom Expression and
monitor all its properties in a convenient tree structure
Immediate Window support
Simply type in a
variable (or expression) in a separate Immediate
Window Panel, click enter and instantly see the value of that
variable (or expression) right on the next line
Change any variable value and
any expression value
in that same
Immediate Window panel
Dedicated
Debug.WriteLine window panel
Trace your code using Debug.WriteLine
Debug files included with
<SCRIPT SRC=....> tag
Unlimited number of <SCRIPT SRC=....>tags
supported
Just set a breakpoint in that
included file and when it will be hit the debugger will include it in debugging process.
Advanced Form Debugging
Perfect for Form
Validation - Validate order forms in client's
browser window before they are submitted
Pop-Up Debugging
Debug JavaScript Pop-Up
windows
Full featured HTML Debugger and Editor
Debug
HTML/DHTML files stored locally and
stored on your server
Debug HTML/DHTML pages
dynamically generated by PHP,
ASP, JSP etc.
Debug DHTML Behavior
Debug any JavaScript
Menu and DHTML Menu
Debug JavaScript and VBScript
events
Debug onclick, onmouseover,
onfocus and any other event
Debug window.onload
Pause execution with Cause Break feature
Full featured HTC Debugger and Editor
Debug Browser-Side Controls
Debug Calendars, and any other
control
Debugger
keyword now fully supported
Monitor values of
any variable in a separate panel
Priceless for
AJAX developers to evaluate long strings with
XML or HTML
Debug JavaScript in AJAX
applications
AJAX applications fully supported
Multi-Functional Browser-Side VBScript and
JavaScript Script Editor
(for HTML ad DHTML), featuring:
User-friendly Intuitive Contemporary Interface
Color-coded syntax. This
feature can save countless hours, since it helps you quickly
spot obvious errors such as missing quotation marks.
Full Support for native
VBScript and JavaScript syntax
Recent Documents List
Open Files List
(on-screen)
Line Numbering
Line/Column Position indication
Execution LineHighlighting. See the current line of the code to be executed.
Open multiple files at once
Multiple fonts support
Columnar blocks
Unlimited multilevel
undo/redo
Unlimited file size and
line size
Customizable movable and
dockable user interface
Unlimited Bookmarks
- set
bookmarks anywhere you wish throughout your code
Complete Documents List
List of all included files
Unlimited included files
supported
Integrated Step by Step Debugging
Assistant
Instantly check what's your next step -
how
to set a breakpoint etc.
Direct to point, easy to follow
hints
Hints appear in the upper-left
corner of the main window
Movable and dockable
Hints
Panel
Very user-friendly explicit
JavaScript Bug Reporting
Run-Time Error Handling
Runtime errors usually are illogical or incorrect reasoning in your
script. I.e. a very common error in JavaScript is
mismatched data types — something like trying to perform a
mathematical calculation on a data string
Set | Clear Breakpoints
Step in | Step out | Step over
Debug | Go
Show Last Error
See the exact
position where the latest error occurred and the
description of that error message - right over your code
Variable Watch
Enter variables and
monitor their values - live
Variable
Hint - see the value of your variable by moving the
mouse over it
Expression Evaluation and
Watch
Monitorcompleteexpressions and watch their values, i.e. 'x+10'
Expression Evaluation
Hint- see the value of your expression by moving the mouse
over it, as you go!
Client-side Script Debugging
of
native VBScript code and
native JavaScript code (including
MS JScript)
No manual configuration
No network configuration needed
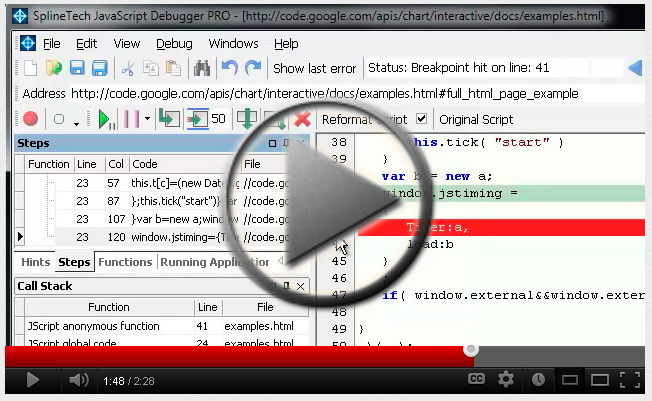
Step-by-Step Multimedia Tutorials and
Functional Demonstration
Frequently Asked Questions (FAQ)
featuring
every JavaScript debugging
issue covered
updated regularly
User-friendly feature-rich award-winning JavaScript Debugger
and Editor
User-friendly
environment - made and improved with JavaScript Developers like you in mind
Intuitive interface - ready to debug right away, virtually no learning required
Feature-rich - packed with all the features that any serious JavaScript Developer must have
Completely customizable and adjustable elements
of user interface
Malcolm Here - That Code is now completely clean - record time to find 12+ Coding errors. TX V-Much for both your help and you demonstrations. Steping through code & into functions etc is great. After a day or two, it'll be the turn of the ASP debugger, and the the VBScript debugger. TX again MG
Malcolm Gomersall, South Africa's largest portal — iafrica.com.
I've had a day or two now to play around with the SplineTech
JavaScript Debugger and I'm impressed with it. Just enter a URL and it will open the file
(and included JavaScript files as you step into them) in the debugger and load
it into IE. You can step thru the code, set breakpoints and watchpoints, and
hover over a variable name to see its value. ...the best
thing I've found. The price is very reasonable too... E-mail support is
excellent...
 Pause in 3, 5, 10 seconds
Malcolm Gomersall, South Africa's largest portal — iafrica.com.